
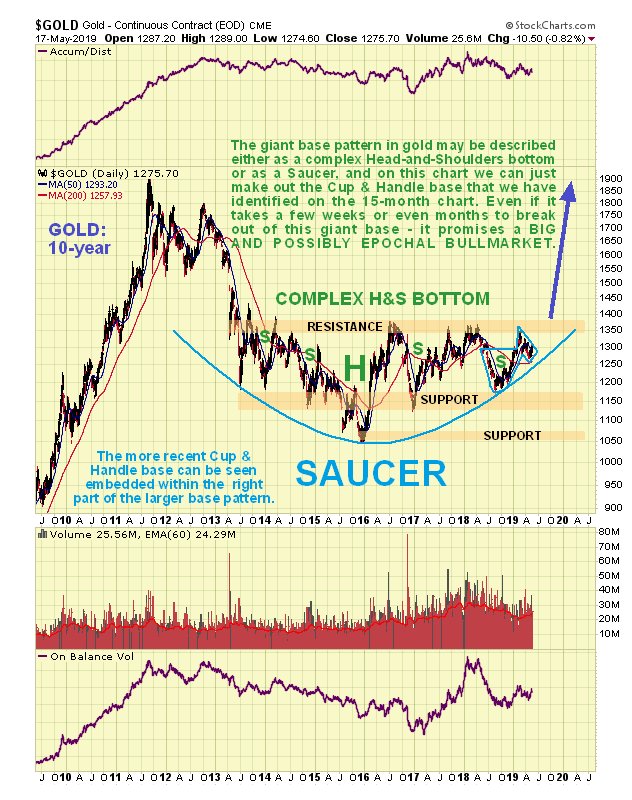
We can best see gold’s potential giant base pattern on a 10-year chart. It can be described as a complex Head-and-Shoulders bottom or as a Saucer, and is best considered to be both, or perhaps as a hybrid having the characteristics of both patterns. In any event, as we can see on this chart, it appears to be drawing close to breaking out of it, which will be a very big deal if it happens, because a base pattern of this magnitude can support a massive bullmarket. As for timing it could take several months and it is most likely to happen during gold’s seasonally strong period from July through September. To maintain the bullish case it must stay above the Saucer boundary.
Embedded within the giant H&S or Saucer base pattern, a fine Cup & Handle base has formed over the past year which we can see to advantage on the 1-year chart. The Handle part of this pattern may be regarded as a period of consolidation / reaction that has allowed time both for the earlier overbought condition arising from the rally from November through February to unwind and also for the moving averages to slowly swing into a much more favorable alignment, which has now happened.
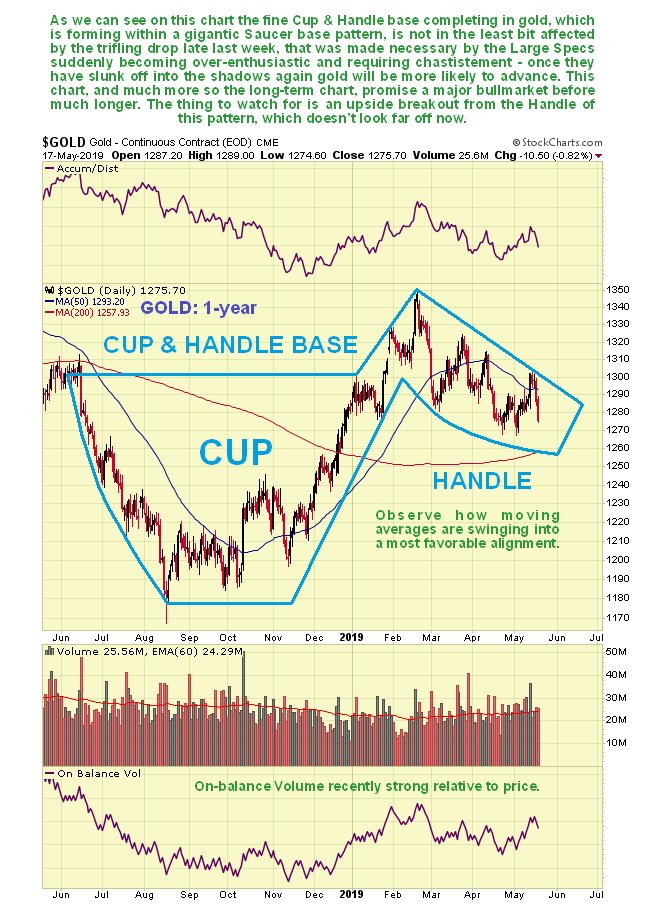
On both of the above charts the drop late last week looks like “a storm in a teacup”