|
— Posted Sunday, 28 September 2014 | Share this article | 2 Comments
By Steve St. Angelo, SRSrocco Report
The values of gold and silver would be substantially higher if it wasn’t for the massive derivatives market. Americans have no idea that the Derivatives Monster destroyed the ability for the market to properly value physical assets, commodities and the precious metals.
I would imagine very few people could state the total value of derivatives in the U.S. Banking Industry in 1990. Actually, I had no idea until I did the research. Of course, I knew it was much lower than hundreds of trillions in Dollars held by the banks today.
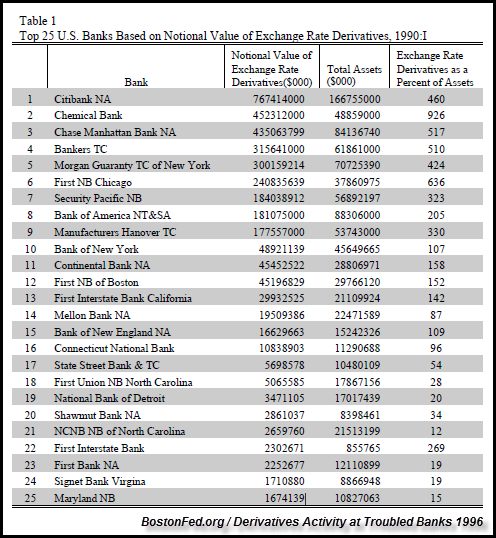
If we look at the table below, we can see the total notional value of derivatives in the top 25 U.S. Banks. This data came from a paper by the BostonFed.org in 1996 titled Derivatives Activity At Troubled Banks:

Adding up these 25 U.S. Banks derivatives holdings, we arrive at a paltry $3.28 Trillion in 1990. The bank with the largest derivatives holdings during the first quarter of 1990 was Citibank with $767 billion. Amazing aye? The number one bank in 1990 didn’t even hold a $trillion of derivatives.
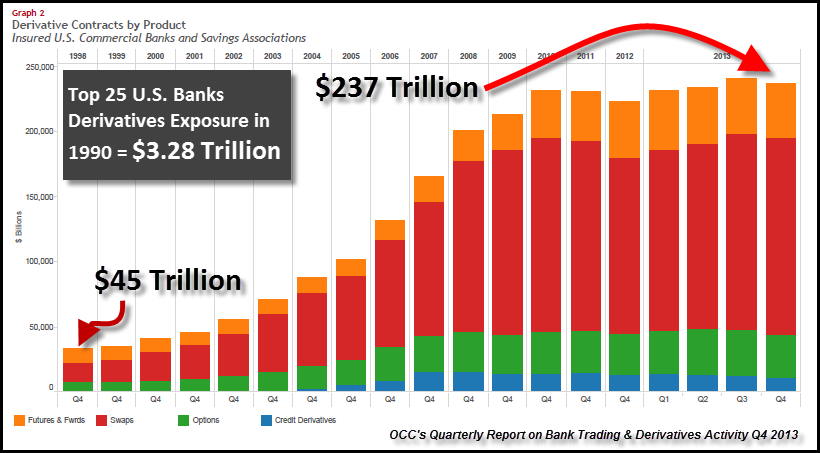
Let’s compare this table to the Office of the Comptroller of the Currency Q4 2013 Report on U.S. Bank Trading and Derivatives Activity:

So, from 1990 total derivatives at the top 25 banks increased from $3.28 trillion to $45 trillion in 1998. As we can see, total derivatives picked up significantly to reach a total $237 million by the end of 2013.
The majority of these derivatives (in red) are interest rate swaps. Thus, the U.S. Banking industry utilized the Interest Rate Swap Market to destroy the REAL MARKET RATE OF INTEREST. By the banks artificially controlling the market rate of interest, they also manipulate the REAL VALUE of goods, services, commodities and yes… the precious metals.
Let’s go back to 1980, when derivatives had a negligible impact on the market. In 1980, the price of gold and silver hit new highs. In January of 1980, silver hit a high of $49 and gold reached $873, while the Dow Jones Average topped 893.
The chart below shows the Dow-Gold Ratio from this same time period. You will notice that in Jan 1980, the Dow-Gold Ratio was nearly 1/1. The price of gold hit $873 and the Dow Jones was 893.

The Dow-Gold Ratio increased substantially until it peaked in 1999 at 44/1. In Jan 2000, the Dow Jones hit a new record high of 11,750. Here was the net result in the change from Jan 1980 to Jan 2000.
January 1980 Highs
Silver = $49
Gold = $873
Dow = 893
January 2000 Highs
Silver = $5.47
Gold = $291
Dow = 11,750
So, as the total of U.S. Bank Derivatives increased 1,150% ($3 trillion to $40 trillion) from 1990 to 2000, the majority of investors were flocking into paper assets of all kinds. This had a profound impact on the markets. From 1980 to 2000, the Dow Jones increased 1,200%, while the price of gold declined 67% and silver fell 89%.
Even though the Fed and Central Banks can control paper prices, they can’t print barrels of oil. When global oil production started to peak , oil prices shot up substantially as competition increased.

The price of Brent crude increased from $25 in 2002 to $111 in 2011. The quadrupling of the price of oil severely impacted the prices of all goods and services in the markets. As we can see from the chart, the price of gold increased with the price of oil, until it was BUSHWHACKED by the Fed and Cartel Banks raid starting at the beginning of 2013.
This can be clearly seen by the Dow-Gold Ratio increasing from a low of 5.8 /1 at the end of 2011 to the nearly 14/1 currently.

The chart shows what the Dow-Gold Ratio would be using the 1980 1/1 ratio at the different Dow Jones Averages. I doubt the Dow-Gold Ratio will ever reach 1/1 at the current valuation of the Dow Jones. However, it will when the broader markets finally POP and head back down into the toilet.
We must remember, the Fed and Western Central Banks along with the Financial Industry have totally distorted the interest rate market. Just look at the change in interest rates in the following countries since 2011. This is an excerpt from the article, Fraud By Any Other Name Is Still A Fraud:
SOVEREIGN BONDS
• US, EU Bond markets rates were effectively dictated by central banks…
o During this massive rotation, US 10yr Treasury yield fell 55% from 3.67% in Jan to 1.67% in August ‘11 (currently 2.36%)
o June ’11 Irish 10yr peaked 14.5%…fell 87% til present (currently 1.78%)
o Oct ’11 Italian 10yr peaked @ 7.5%…fell 68% til present (currently 2.39%)
o Dec ’11 Greece 10yr debt peaked @ 42%…fell 86% til present (currently 5.62%)
o Dec ’11 Portugal 10yr peaked @ 17.5%…fell 83% til present (currently 3.02%)
o Jun ’12 Spanish 10yr peaked @ 7.75%…fell 71% (currently 2.14%)
• However, BRICS interest rates were generally unchanged Jan ’11 – present
o Brazil 12.4% to 11.6%
o Russia 7.8% to 9.3%
o India 8.15% to 8.5%
o China 3.9% to 4.26%
o S. Africa 8.6% to 7.8%
The evidence is clear, the Western Central Banks created the GREATEST FINANCIAL SHOW ON EARTH, but totally manipulating the real market rate of interest. Many of the European countries that were ready to see a collapse of their bond markets, are now enjoying 10 year bonds at substantially lower rates.
How on earth did the Irish 10 year bond fall from a peak of 14.5% in June 2011, to 1.78% currently (at publish date of article)?? If we compare the change in 10 year bond rates from 2011 (and 2012), the U.S.-European rates MAGICALLY all went down, while most of the BRIC countries went higher.
This SLIGHT OF HAND by the Western Central Banks to manipulate their bond markets is not a sustainable business model. When the collapse of the GRAND U.S. TREASURY MARKET finally arrives… the value of gold and silver will skyrocket.
We have already seen the different prices of gold valued at the historic Dow-Jones Ratio of 1/1, so let’s look at silver:

How many investors realized the Dow-Silver Ratio hit 22/1 in 1980? Even when silver hit a high of $49 in April 2011, the Dow-Silver Ratio was nearly ten times higher at 248/1. I posted the different prices of silver compared to different levels of the Dow using the 1980 22/1 ratio.
Just when the price of gold and silver were about to BREAK-OUT at the end of 2012, after QE3 was announced, the Fed and Cartel banks embarked on the policy of CRUSHING the precious metals.
The RED ARROW denotes the direction of the Dow-Silver Ratio if Western Central Bank manipulation of the markets did not occur. Without the Fed & Cartel Bank market rigging, a Dow Jones of 6,000 would mean gold would hit $6,000 (at 1980 Dow-Gold 1/1 ratio) and silver would reach $272 (at 1980 Dow-Silver 22/1 ratio).
The financial markets today are riding on FUMES. There is no way telling how long the FACADE can go on, but with tensions between the West & East increasing significantly, we may see fireworks sooner than later.
Why should the BRIC countries that are experiencing higher (normal) rates of interest in their bond markets continue to allow the West to get away with ultra-low rates? In addition, many of the BRIC and South American countries produce the lions share of the world’s metals and commodities only to see their values plummet due to the manipulation of the paper markets by the West.
Lastly, the majority of Americans are totally DELUDED by the euphoria in the U.S. Treasury and Stock Markets. At some point, the BRICS will pull the plug on the GREATEST PAPER PONZI SCHEME in history, making gold and silver some of the best assets to own. |


