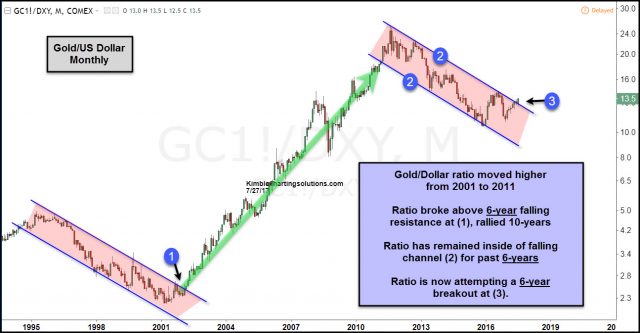
Below looks at the ratio of Gold compared to the US Dollar over the past 20-years. The ratio reflects that some long-term trends have taken place and the ratio is making an attempt to do something it hasn’t been able to accomplish in 6-years.
CLICK ON CHART TO ENLARGE
The ratio broke above 6-year falling channel back in 2001 at (1) and then it proceeded to rally for the next 10-years.
For the past 6-years, the ratio has continued to create a series of lower highs and lower lows inside of falling channel (2).


