Found this:
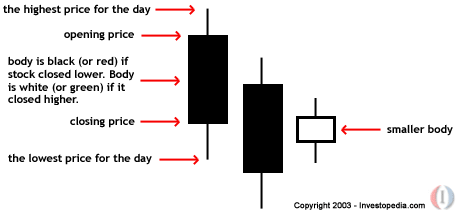
Investors looking to identify harami patterns must first look for daily market performance reported in candlestick charts. Harami patterns emerge over two or more days of trading, and a bullish harami relies on initial candles to indicate that a downward price trend is continuing, and that a bearish market looks to be pushing the price lower.
The bullish harami indicator is a charted as a long candlestick followed by a smaller body, referred to as a doji, that is completely contained within the vertical range of the previous body. To some, a line is drawn around this pattern resembles a pregnant woman. The word harami sourced from an old Japanese word meaning pregnant.
For a bullish harami to appear, a smaller body on the subsequent doji will close higher within the body of the previous day’s candle, signaling a greater likelihood that a reversal will occur.

Read more: Bullish Harami https://www.investopedia.com/terms/b/bullishharami.asp#ixzz5OeJVlr3z
Follow us: Investopedia on Facebook
