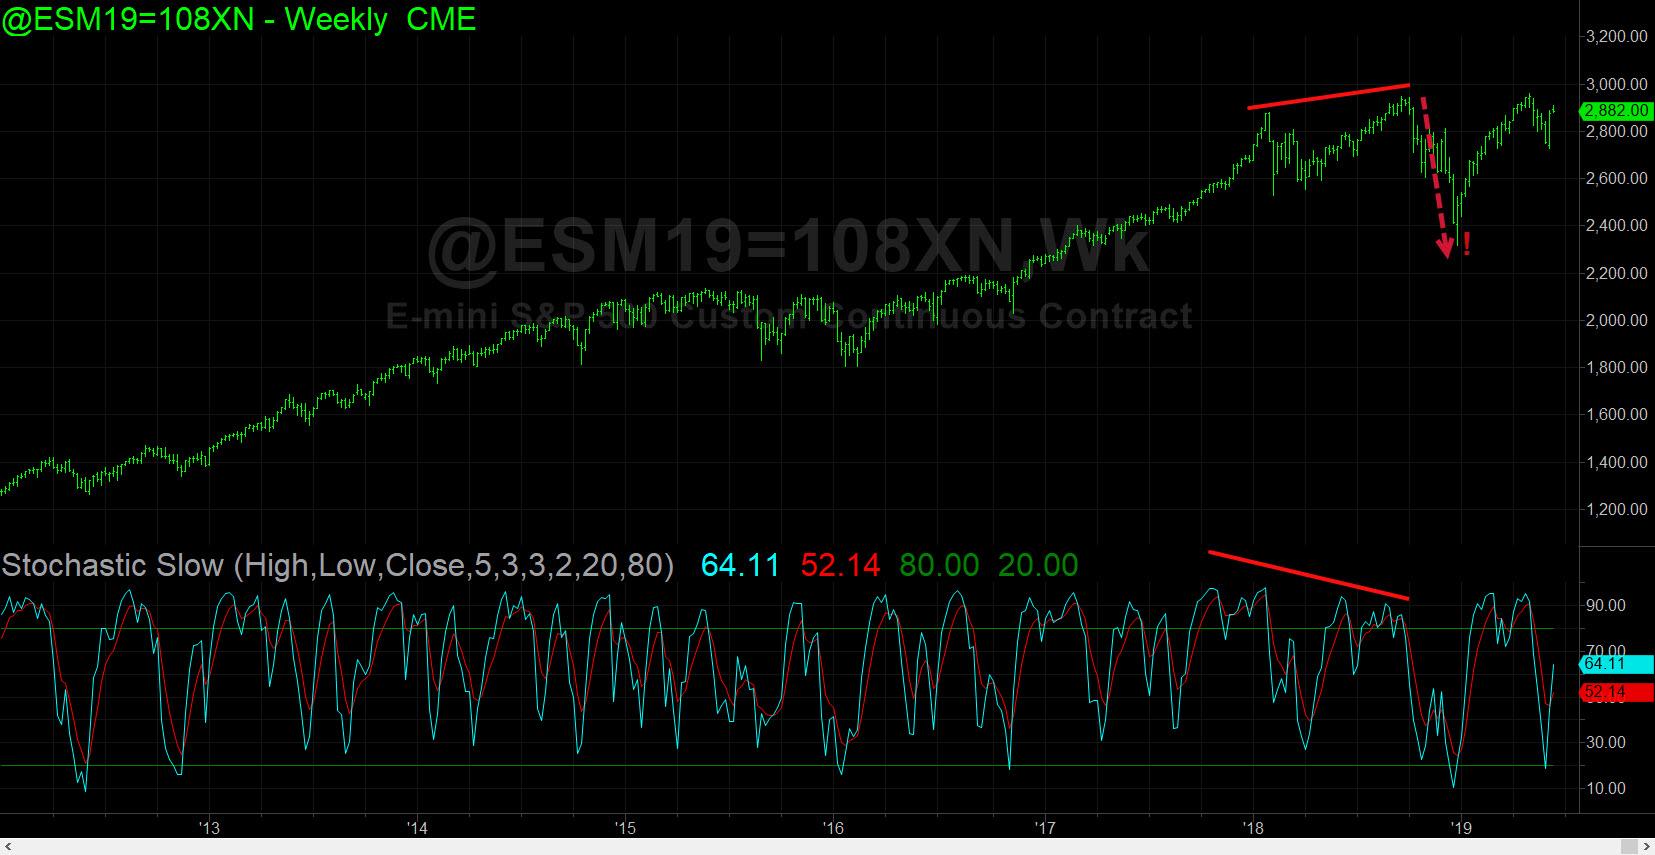
 Although there are a dozen good reasons why the bull market should flame out, like, tomorrow, there’s nothing in the long-term charts to suggest this is likely. A friend and fellow permabear sent me an Elliott Wave theorist’s prediction that the sensational run-up begun more than ten years ago could continue for another three or four years. This is based on a five-wave Elliott pattern that is currently in its final phase, having corrected the spectacular excesses of Wave 3 via the Great Financial Crash of 2007-08.
Much as I would love to see the market plunge into molten hell so that the global economy, born again, could cycle back to more-honest weights and measures, I am resigned to the likelihood that the bullish charts are simply correct. This is notwithstanding tariff wars, a global economic slowdown, falling commodity prices, falling bond yields and all the rest. Wall Street seems not to care about any of this, and so the buy-the-dips crowd reigns supreme. They will get their comeuppance someday, for sure. But as long as investable cash remains in more or less unlimited supply, stocks will continue to rise.
Placid Stochastics
The weekly S&P chart (click on inset) corroborates the bullish EWT perspective. Notice that a divergence between price tops and stochastic tops accurately foretold the devastating selloff that occurred in Q4 of 2018. Currently there are no such divergences in the weekly chart, and I take this as a sign that the long-term uptrend will continue. That could change if the current rally achieves new record highs without generating a higher stochastic peak. But until such time as this occurs, there are no worrisome signs that I can discern in this chart. For a more detailed explanation of stochastic divergences and their relevance to the current technical picture, click here to view my latest Facebook video.

