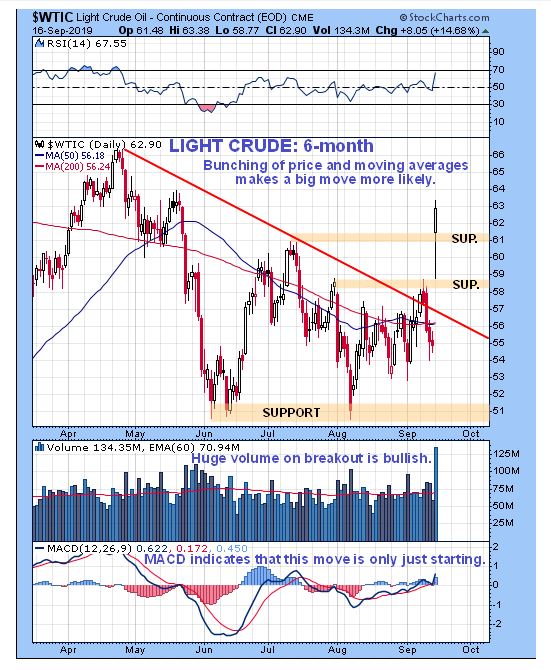
So, we are drawing ever closer to the bombing of Iran, and that obviously could lead to much higher oil prices, and having figured this out fundamentally, we will now look at what the charts have to say.On the latest 6-month chart for Light Crude we see that the weekend’s incidents generated a big breakaway gap in crude at the open, after which it did its customary drop down to test support at last week’s intraday high, before rallying back to close near to the day’s highs. This move was on very heavy volume which is bullish and looks like the start of a major new uptrend.

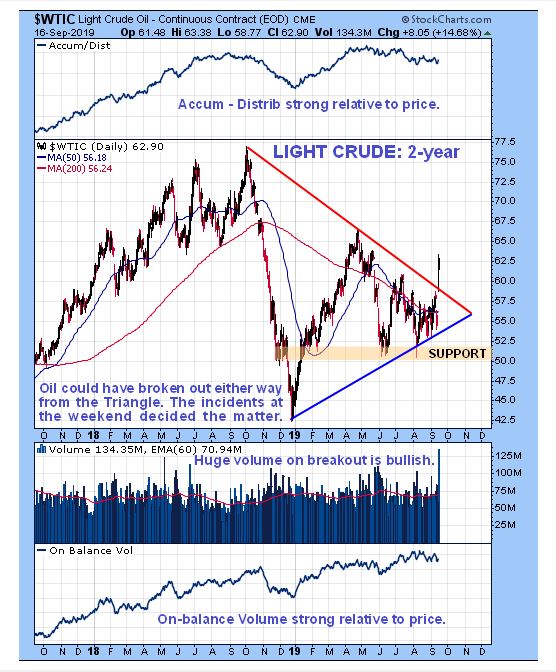
On the 2-year chart we can also see that today’s move broke the price out of a large Symmetrical Triangle. A breakout from this Triangle was due, but it could have happened in either direction, with the deciding factor being what happened at the weekend. An interesting point to observe on this chart is how the oil price had become progressively “quieter” as it coiled in towards the center of a logarithmic spiral (not shown), which implies that the move now starting is going to be substantial, especially as it kicked off with a big up day on massive volume.

Once the bombing starts, which now appears to be only a matter of time and probably not so much at that, we can expect the oil price to continue to advance steeply, which will severely impact the already frail debt-burdened economy, and we can expect the stockmarket to crash in advance of this.
